Reaction time by age is one of those measurements where the popular story and the data disagree. The story says you are fastest at eighteen and slower every year after. The research says something quieter: simple visual reaction time peaks in the early twenties, stays close to that peak for decades, and only drifts noticeably after about fifty. This guide lays out typical ranges by age group, explains which part of the response slows down, and shows how much of the change you can influence. If you want your own number before you read the tables, take the free reaction time test first — five attempts and you have a baseline.
What the research says about reaction time by age
The cleanest modern dataset is the calibrated study by Woods and colleagues (2015), which tested 1,469 adults aged 18 to 65 on a timing-precise visual reaction task. After correcting for hardware delays, mean simple reaction time rose by only about 0.55 ms per year, from roughly 200 ms in the youngest group to about 222 ms in the oldest. That is a rounding error across a decade, not a cliff.
The larger UK Health and Lifestyle Survey analysis of 7,130 adults (Der & Deary, 2006) adds the shape of the curve. Simple reaction time shows little slowing until around age 50; choice reaction time, which asks you to react and decide, slows gradually across the whole adult range. Together they describe the pattern most people recognise: a long, flat prime, then a gentle bend after fifty.
Typical reaction time by age
The table below turns that research into working ranges for a visual online test, where device lag and day-to-day variation are part of the measurement. It matches the table on our average reaction time page.
| Age group | Typical average (visual, online test) | Relative to peak |
|---|---|---|
| 10–19 | 200–250 ms | Approaching the early-20s peak |
| 20–29 | 190–230 ms | Peak years |
| 30–39 | 195–240 ms | Within ~5–10 ms of peak |
| 40–49 | 205–250 ms | Within ~10–15 ms of peak |
| 50–59 | 215–265 ms | Decline accelerates after ~50 |
| 60+ | 225–300 ms | Typically 20–45 ms past peak |
Research-based ranges anchored on Woods et al. (2015) and Der & Deary (2006), widened for device lag and individual spread. Individuals vary far more than decades do — a trained 55-year-old routinely out-reacts an untrained 25-year-old.
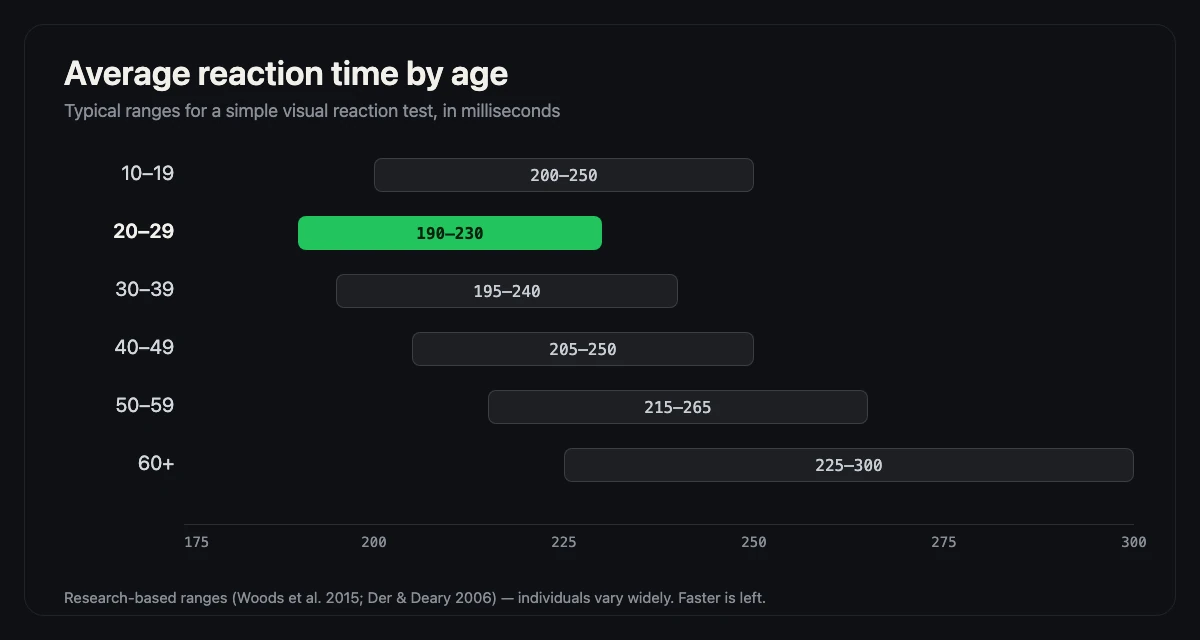
The total change from the peak group to the 60+ group is roughly 35 to 70 ms, depending on where in each range you land. That is real, but it is about the size of the swing a poor night's sleep can produce — a clue that age is not the only variable worth watching.
Why reaction time slows with age: perception vs movement
The most useful finding in the Woods study is not the slope but the decomposition. The researchers estimated stimulus detection time — the part of the response that is pure perception — and found it unchanged with age. What lengthened was movement initiation: the time between registering the signal and getting a finger moving. A slower score in your fifties usually does not mean you saw the green later; the motor stage took longer to launch.
This fits both curves. A simple test has almost no decision, so its age penalty stays modest until the motor side becomes the bottleneck. A choice test adds selection and inhibition, which is why it declines across the whole adult range instead of holding flat until fifty. It also explains why the practical fixes are physical: warm the hands, shorten the movement, remove input lag.
How much of reaction time by age can you influence?
More than the age table suggests, less than the supplement ads promise. Four levers have real evidence behind them:
- Sleep. The gap between a rested and a short-slept version of the same person can reach 20–50 ms — larger than the step between most neighbouring age bands. A single bad night is a measurement problem, not a verdict on your nervous system.
- Practice with the task. The first rounds on any new test are learning rounds; most people drop 20–40 ms once the sequence becomes automatic. The gain is specific to what you practise — our guide to improving reaction time starts with the exact task you care about.
- Activity and alertness. Regular aerobic movement is associated with better processing speed across age groups, and even a short warm-up raises alertness for the next few minutes. Neither is a miracle, but both are free.
- Device lag. A 60 Hz screen redraws every 16.7 ms, and input plus display processing adds roughly 30 ms on a typical desktop. A wired mouse, a higher refresh rate and game mode can return 10–40 ms before your nerves change at all.
None of these repeal the curve. You can be a fast sixty-year-old and a slow twenty-five-year-old on the same afternoon; you cannot train your way back to your own twenty-year-old motor output. The honest goal is to sit near the fast edge of your own band, consistently.
Age vs practice: who really wins
The spread inside an age group is wider than the gap between the groups. Look at the table again: the 20–29 range spans 40 ms, and so does the 50–59 range. A practised 55-year-old who sleeps well and tests on a wired mouse will beat an untrained 25-year-old on a laptop trackpad more often than not. Age sets the centre of your distribution; practice, sleep and equipment decide where inside it you land.
One caveat. Getting better at a reaction test is not the same as getting faster in a sport, a car, or a kitchen. The improvement is largest for the exact task you rehearse and shrinks as the task changes. That does not make practice useless — it makes it specific. Train the movement you actually care about, and use the test as a ruler rather than a sport. Our methodology page explains exactly how a round is measured.
Reaction time by age tells you where the centre of your group sits, not where you sit inside it — that is what testing is for. If you want the complementary no-screen version, the ruler drop test turns a falling ruler into milliseconds; the CPS test measures clicking speed if you want to train the movement side of the chain.
Check your own age range
Move the slider to your age. The panel shows the typical range for your group, how far it sits from the early-20s peak, and one honest sentence about what it means. The numbers come from the table above; nothing is stored or sent.
Age check
Slide to your age — the result updates instantly. Keyboard: arrow keys, Home and End also work.
Ages 10 to 80, one year at a time.
Ages 10–19
200–250 ms
Approaching the early-20s peak — typical scores run about 10 ms behind it.
Reaction speed is still developing through the teenage years. A number at the slower end of this range is normal, and it is not a verdict on your potential.
Ages 20–29
190–230 ms
The peak years — no age offset applies.
This is the fastest decade on average, but individual scores still spread by tens of milliseconds. Compare your own rounds, not the group label.
Ages 30–39
195–240 ms
Within about 5–10 ms of the peak.
The decline is small enough that sleep, warm-up and your device usually matter more than the decade you are in.
Ages 40–49
205–250 ms
About 10–15 ms past the peak.
A trained 45-year-old beats an untrained 25-year-old often enough that age alone predicts very little about your next score.
Ages 50–59
215–265 ms
The decline accelerates — typical scores run about 25 ms past the peak.
This is where the research curve bends, not where it falls off a cliff. Practice and sleep still move the number by tens of milliseconds.
Ages 60+
225–300 ms
Typically 20–45 ms past the peak.
The movement stage accounts for most of the age difference, so a slower click does not mean you saw the signal late. Warmed-up hands and a fast device are worth real milliseconds.
Frequently asked questions
At what age is reaction time fastest?
The early twenties. In the research ranges used on this page, ages 20–29 sit at the peak at roughly 190–230 ms on a visual online test. Simple reaction time stays close to that peak through the thirties and forties, so the difference between a sharp 25-year-old and a sharp 45-year-old is usually smaller than either would guess.
At what age does reaction time start to decline?
Noticeably after about 50. Controlled data show simple reaction time holding fairly steady through early adulthood, with the decline accelerating from around age 50; choice reaction time, which includes a decision, slows gradually across the whole adult range. The table on this page reflects that shape rather than a straight line from age 20.
How much slower is a 60 year old?
On the ranges used here, the 60+ group typically reads 225–300 ms against 190–230 ms in the peak 20–29 group — about 35–70 ms slower at the same measurement point. Controlled lab work puts the average change from the youngest to oldest adult group at roughly 22 ms once hardware delays are removed, so the larger online gap includes device and strategy differences as well as biology.
Can you improve reaction time at any age?
Yes, within limits. Sleep, task-specific practice, aerobic activity and a lower-lag device can move your score by tens of milliseconds at any adult age. What training does not do is erase the age curve: it moves you within your band, and it improves most at the task you practise.
Is 250 ms a good reaction time?
Yes. Around 250 ms is the slower edge of the typical adult range of 200–250 ms on a visual test, so it is normal rather than slow. If you are in the 20–29 group the peak range is faster at 190–230 ms; if you are over 60, 250 ms sits comfortably inside the 225–300 ms range for your group.
For the wider picture of what changes a score — sleep, devices, training — see the guides index.
References
- Woods, D. L., Wyma, J. M., Yund, E. W., Herron, T. J., & Reed, B. (2015). Factors influencing the latency of simple reaction time. Frontiers in Human Neuroscience, 9, 131. PMC full text
- Der, G., & Deary, I. J. (2006). Age and sex differences in reaction time in adulthood: results from the United Kingdom Health and Lifestyle Survey. Psychology and Aging, 21(1), 62–73. PubMed record