This page documents precisely how the reaction time test works when you press the board — the timing logic, the scoring math, and what happens to your data. Everything below describes the code running in your browser today, step by step.
How the reaction time test works
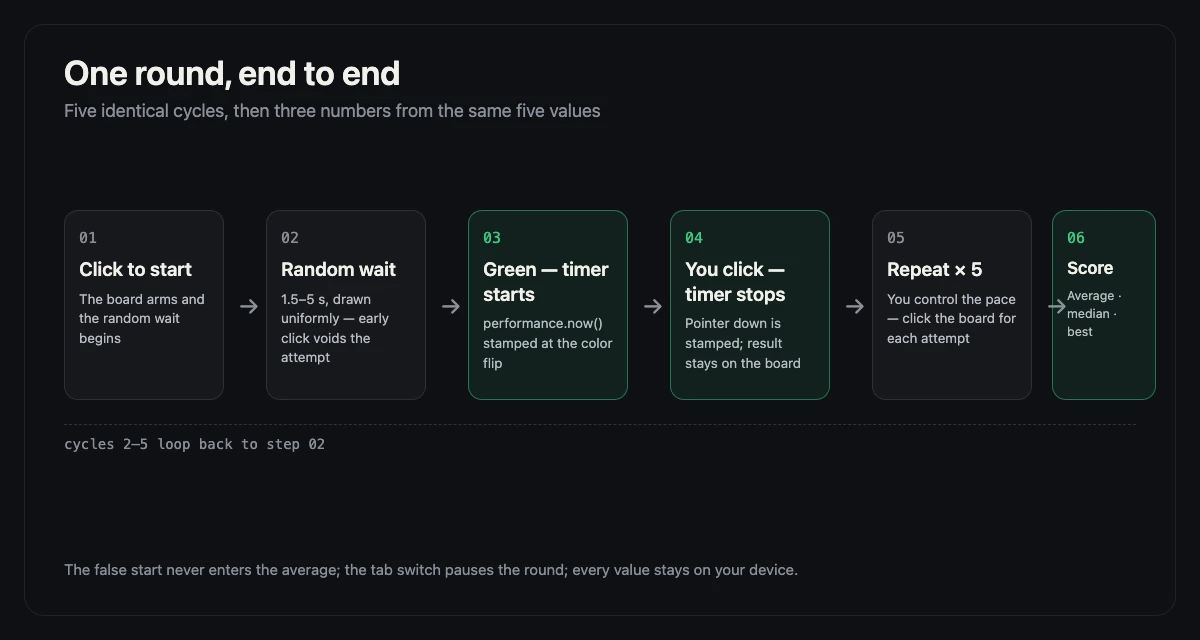
The test measures simple visual reaction time: how long it takes you to respond to one visual signal with one click or tap. The timer starts the instant the board turns green and stops the instant you press. The result is the difference in milliseconds (ms) — nothing else: no movement accuracy, no decision-making, just signal-to-click latency. If you want the conceptual distinction, read simple vs choice reaction time. For a deeper explanation of the display, input, and browser stages inside that latency, read what a reaction time score really includes; for device differences, see mouse vs touchscreen reaction time; for setting up your own comparison, see latency calibration.
One round, five attempts
A round consists of five attempts. After each attempt your time stays on the board; you click to start the next one, so the pace is yours. When the fifth attempt lands, the round is scored:
- Average — the mean of the five attempts, rounded to the nearest millisecond. This is your score.
- Median — the middle value of the sorted five; robust to one wild outlier.
- Best — your fastest single attempt of the round.
We score the average rather than any single attempt because individual attempts scatter by 30–80 ms even in the same person. The mean of five is the standard across reaction test sites, and it feeds our rating table and server rankings.
The wait window and false starts
After you click to begin, the board waits a random 1.5 to 5 seconds before turning green. The randomness is the whole point: any fixed rhythm could be anticipated, and anticipating is not reacting. If you click while the board is still waiting, the attempt is voided — the board shows "Too soon!" — and you click again to retry; the false start never enters your average. If you switch tabs mid-wait, the round pauses and resumes only when you return and click.
Units and rounding
All scores are reported in whole milliseconds, rounded from the browser's high-resolution clock (performance.now()). If you choose to add a result to the site ranking, the server independently validates that a submission contains exactly five integer attempts between 100 and 2000 ms whose mean matches the reported average — implausible structures are rejected before they can touch the ranking.
Reaction time test accuracy
What can a browser test promise? The arithmetic is effectively exact — the clock resolves far below a millisecond. The uncertainty lives between code and nerves: the green appears only at your monitor's next refresh (up to 16.7 ms away at 60 Hz), and the click travels the input stack before it is stamped. On the same device, same browser, same hour, consecutive rounds typically reproduce within 10–20 ms — which is exactly why one attempt is trivia and the five-attempt average is the score.
So the honest claims: as a personal benchmark — you versus yourself over weeks on one setup — it is highly consistent, sensitive enough to show training effects of 10–30 ms. As an absolute measure of nerve speed, any online score carries the device chain, typically 20–40 ms on a desktop and far more on some TVs. And as a medical instrument it is not one: no browser test can diagnose anything. Clinical measurement belongs in a lab with calibrated hardware.
Why scores include device latency
Your score is not pure nerve speed. A 60 Hz monitor redraws once every 16.7 ms, so the green can arrive almost a frame late; a 144 Hz display cuts that to about 6.9 ms. Mice, trackpads, and touchscreens add input-processing time, and the browser plus operating system add display lag — roughly 30 ms on a typical desktop before your nerves are involved. Phone and computer scores are therefore not comparable; test on the same device, at a similar hour.
How the rating is assigned
Your five-attempt average maps to one of eight fixed bands: 150 ms and below Excellent; 151–170 Very good; 171–190 Good; 191–220 Above average; 221–260 Average; 261–350 Below average; 351–500 Slow; above 500 Training needed. The boundaries live in one thresholds array shared by the table and the scoring code, so the word on the board and the word in the table can never disagree.
How we validate the tests, and what we do not claim
Every release is checked in a real browser on macOS with Chrome, at a desktop viewport (1440×900) and a mobile viewport (390×844), in both light and dark themes. The functional checks cover start and reset, early clicks, multiple rounds, local history, keyboard and pointer input, and embed mode; we also run HTML5 and accessibility checks. These are product-quality checks, not a laboratory calibration.
We do not claim to have measured the absolute photon-to-click latency of your display or input device, and we have not validated every release with a photodiode or a high-speed camera. The score includes device latency, which is why the site reports it as a personal benchmark rather than a laboratory measurement. Our accuracy guide explains the chain in detail.
For public aggregates, the server accepts only a completed five-attempt round: five integer attempt times within 100–2000 ms whose mean matches the submitted average. Invalid or automated submissions are discarded or rate-limited (30 submissions per IP hash per day). Stored data is bucket counts only; we do not keep individual records. When the sample is small, we say so rather than presenting an empty sample as a distribution.
If you find a behaviour that disagrees with this page, report it through Contact. For keyboard access and the visual limits of the tests, see the accessibility guide. A reproducible discrepancy is treated as a bug, not as a marketing problem.
For a practical guide to personal baselines and score variation, see reaction time test reliability.What we store
By default everything stays on your device: best score, last 50 rounds, and theme preference live in local storage (keys prefixed rt_) and are never transmitted. If you tap "Add my result", only your average and five attempt times go over HTTPS, stored as anonymous counts inside 10-millisecond buckets — never an individual record — plus an optional, separately-counted age band never linked to your score. Your IP becomes a salted daily hash used only to rate-limit (30 submissions a day). If the request fails, the page says so; your local result is unaffected.
Where the reference numbers come from
The 200–250 ms "typical adult" range comes from published research: Kosinski's 2012 review reports visual simple reactions of roughly 180–200 ms under controlled conditions; Woods et al. (2015) measured a 0.55 ms-per-year age slope; Der & Deary (2006) characterized change across 7,130 adults; and Human Benchmark's published statistics (81+ million clicks) put the median online click at 273 ms with real-world device lag included. Full citations live on the average reaction time page.
Change log
Material changes to the tests, scoring, or public documentation are recorded here. This is not a complete commit history; it is a readable record for visitors who want to know whether a claim or a score changed.
- 2026-11-03 — six test pages expanded and differentiated; guides expanded with citations and exact update dates; author/operator and editorial pages revised; aggregate submission and ranking disclosures added; internal-link gate introduced; exact page update dates adopted.
- 2026-11-02 — number memory, spacebar, age, widget, and i18n pages published; indexing and content-depth work begun; i18n pages later noindexed pending a full localization plan.
- 2026-10 — measurement documentation, accessibility checks, and the local-first scoring model consolidated on this page.
Frequently asked questions
How many attempts does the ReflexTimer test use?
Five per round. The average of the five is your score, and the result panel also shows the median and your fastest attempt. One lucky or unlucky click cannot dominate the number.
What is a good reaction time on this test?
For a simple visual test like this, research puts the typical adult range at 200–250 ms; under 200 ms is fast. Online scores run higher than lab numbers because your device adds latency — see the average reaction time page for the sourced breakdown.
Does the test work on mobile?
Yes — tapping the board counts exactly like a mouse click, and your history is stored on the phone itself. Phone scores usually read slower than desktop scores, so compare only against other runs on the same device.
Why did my score change between devices?
Because the measurement includes the device. A 60 Hz screen redraws every 16.7 ms, a 144 Hz screen every 6.9 ms, and the input chain typically adds 20–40 ms on top of that. The same nervous system can legitimately read 220 ms on one setup and 260 ms on another.
Is my data stored on a server?
Only if you tap "Add my result": your round average and five attempt times are sent over HTTPS and stored as anonymous bucket counts — never as an individual record — with your IP reduced to a salted daily hash for rate limiting. Everything else, including your full history, lives in your browser's local storage and never leaves your device.
In short: five honest attempts, a random wait you cannot game, the average as your score with median and best alongside, millisecond precision, local-first storage — and an optional privacy-preserving ranking on top. Take the test and see where you land.