If you are wondering which tool to trust with your time, we keep a verified, hands-on comparison of the main sites like Human Benchmark — including this one, scored with the same scrutiny as everyone else.
What is the average human reaction time?
For a simple visual signal — a light flipping on, a screen turning green — the average reaction time of a healthy adult is 200 to 250 milliseconds. That is the honest answer to "what is a typical reaction time," and it is a range on purpose: individual attempts scatter by 30–80 ms even in the same person, so any single number hides more than it reveals.
Lab studies that strip away screens and operating systems report visual simple reaction times of roughly 180–200 ms — Galton's Victorian-era measurements came in at 181–189 ms, and a modern calibrated replication averaged 213 ms once hardware delays were removed (Woods et al., 2015). Big online datasets run slower: Human Benchmark reports a median of 273 ms across more than 81 million clicks, because every consumer device adds lag — around 30 ms on a typical desktop, and more on touchscreens. Both numbers describe the same nervous system; the difference is the equipment sitting between the signal and your finger.
The practical reading: under 200 ms is fast, 200–250 ms is squarely normal human reaction time, and anything up to about 300 ms is still common once phones, trackpads, and tired evenings enter the picture. If you want one clean comparison point, your five-attempt average from the test above is measured the same way as the numbers in every table below.
Average reaction time by stimulus: sight, sound, and touch
Your nervous system does not treat all signals equally. Hearing is the fastest channel, touch sits close behind, and vision — the one most online tests measure — is the slowest of the three, in large part because a visual signal physically takes 20–40 ms to reach the brain, while sound arrives in about 8–10 ms.
| Stimulus | Typical simple reaction time | Why it lands there |
|---|---|---|
| Sound | 140–160 ms | Fastest path to the brain; used for sprint starts |
| Touch | 150–155 ms | Direct somatosensory signal; no visual processing |
| Sight | 180–200 ms (lab) · 200–250+ ms (online) | Phototransduction + device lag add up |
The lesson for fair comparisons: only ever compare numbers produced by the same kind of stimulus and the same kind of device. A 180 ms sound reaction and a 220 ms screen click are not competing results — they are different measurements.
Average reaction time by age
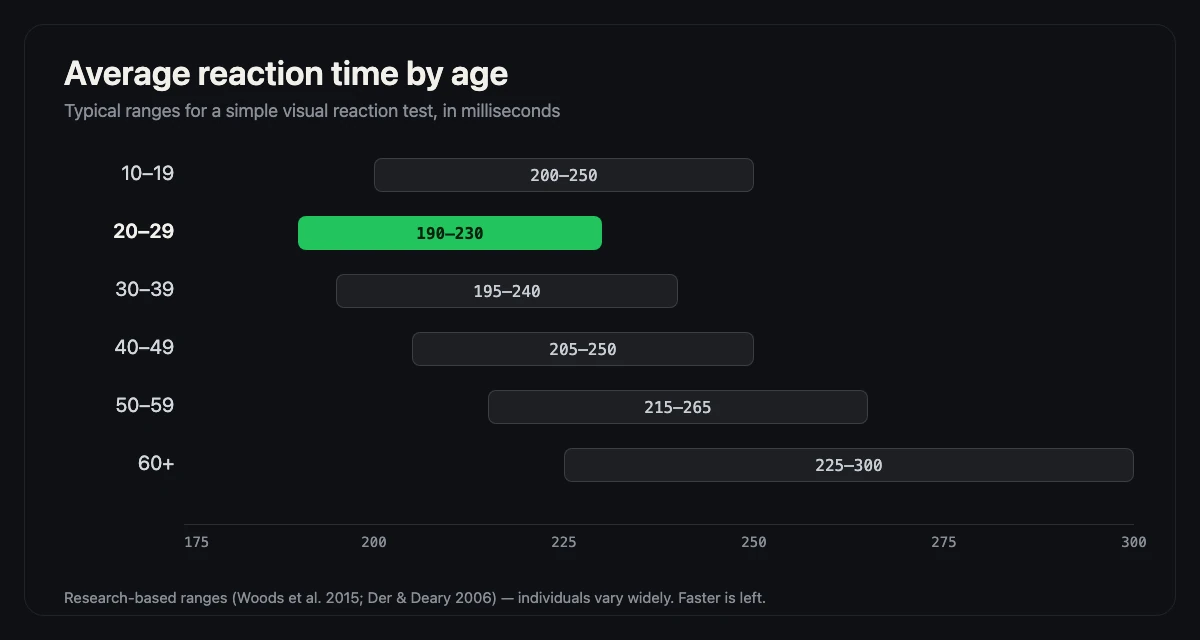
Reaction speed develops through childhood and the teenage years, peaks in the early twenties, and then — this surprises people — barely moves for decades. Controlled work by Woods and colleagues (2015) found simple reaction time lengthens by only about 0.55 ms per year, drifting from roughly 200 ms in the youngest adults to about 222 ms by age 65. Their data also showed the perception stage stays constant with age — the extra milliseconds come from the movement stage, not from seeing the signal later.
The larger UK Health and Lifestyle Survey analysis of 7,130 adults (Der & Deary, 2006) adds the shape of the curve: simple reaction time holds steady until around age 50, after which the decline accelerates, while choice reaction time (reacting and deciding) slows gradually across the whole adult range. The table below compresses that research into working ranges for the visual click test above.
| Age group | Typical average (visual, online test) | Relative to peak |
|---|---|---|
| 10–19 | 200–250 ms | Approaching the early-20s peak |
| 20–29 | 190–230 ms | Peak years |
| 30–39 | 195–240 ms | Within ~5–10 ms of peak |
| 40–49 | 205–250 ms | Within ~10–15 ms of peak |
| 50–59 | 215–265 ms | Decline accelerates after ~50 |
| 60+ | 225–300 ms | Typically 20–45 ms past peak |
Research-based ranges anchored on Woods et al. (2015) and Der & Deary (2006), widened for device lag and individual spread. Individuals vary far more than decades do — a trained 55-year-old routinely out-reacts an untrained 25-year-old.
If you are wondering about your own decade specifically, the most reliable answer is the one you generate yourself: run two or three rounds on the test above and compare your average with the row for your age group.
For the full breakdown — including what each row means relative to the peak and a quick age check — see the complete reaction time by age guide.
What affects your reaction time?
The spread between a great day and a bad one is bigger than the spread between most age groups. The big levers, in roughly the order they matter:
- Sleep. The classic comparison: after 17–19 hours awake, performance on a simple reaction task matches a blood alcohol level of about 0.05% (Dawson & Reid, 1997, Nature). Two weeks of six-hour nights degrades attention as much as one or two nights of total sleep loss (Van Dongen et al., 2003, Sleep). A bad night can easily cost you 20–50 ms. Our sleep and reaction time guide explains the PVT evidence and why lapses matter.
- Attention and anticipation. A reaction test rewards reacting, not predicting. Trying to guess the green usually produces false starts and slower honest clicks; a quiet, focused mind is worth 10–30 ms.
- Practice with the specific task. The first rounds on any new test are learning rounds. Most people drop 20–40 ms within their first few rounds as the sequence becomes automatic.
- Caffeine. A moderate dose reliably speeds simple reaction time and vigilance in rested and sleep-deprived adults alike (Einöther & Giesbrecht, 2013, Psychopharmacology). It is a small, real effect — not a superpower; our caffeine evidence guide covers the dose, tolerance and withdrawal caveats.
- Device lag. A 60 Hz monitor redraws only every 16.7 ms; input and display processing add roughly 30 ms on a typical desktop (per Human Benchmark's notes). A wired mouse on a 144 Hz screen can shave a visible slice off your score before your nerves change at all. Our accuracy guide breaks down the full measurement chain, and the mouse vs touchscreen guide explains why phone and desktop scores are not directly comparable.
- Age, alcohol, cold hands, a heavy meal. Real but gradual effects; worth knowing about, rarely worth obsessing over.
Reaction time in athletes, gamers, and F1 drivers
Do professionals leave normal humans behind? Sometimes — but the gaps are narrower than highlight reels suggest, and each sport measures something slightly different.
| Group | Typical measured reaction | Context |
|---|---|---|
| General adult (online visual test) | 200–250 ms | The baseline this page measures |
| Regular FPS / esports players | 150–200 ms | Practice effect on this exact task type; action gamers respond faster with no accuracy loss (Dye, Green & Bavelier, 2009) |
| Elite sprinters (gun to block force) | 150–170 ms mean | Measured to the starting gun; under 100 ms is ruled a false start by World Athletics (Kukolj et al., 2013) |
| F1 / professional racing drivers | ~200 ms to an unexpected signal | Their edge is anticipation and braking points, not raw speed — studies of racing experts find the gap over novices lives mostly in prediction |
Two honest caveats. First, these numbers come from different rigs measuring different events — a starting block force sensor is not a mouse click — so treat the table as orientation, not a leaderboard. Second, in every sport studied, trained reaction to sport-specific cues improves far more than general reaction, which is why elite drivers and sprinters look superhuman in context and merely quick in a generic test.
What is a good reaction time for you?
The average human reaction time is a population statement; your useful benchmark is your own trend. Measure your average across five attempts today, come back next week on the same device, and let the delta — not a population table — tell you whether you are sharp. If your number lands where you want it, our CPS Test measures the complementary skill, clicking speed, while the classic no-screen version is the Ruler Drop Test. For mouse aim, try our Aim Trainer. And if you want to move your average, the methods that actually work are covered step by step in our guide to improving reaction time.
Frequently asked questions
Is 200 ms a good reaction time?
Yes. Around 200 ms is toward the faster end of the normal adult range of roughly 200–250 ms on a visual test, and it beats most casual scores — large testing sites report medians nearer 270–280 ms once device lag is included.
What is a normal reaction time for my age?
For adults, simple reaction time stays near the early-20s peak of about 190–230 ms until around age 50, then declines a little faster. From 50 to 65 it typically rises by only ~15–25 ms in controlled studies, and individuals vary far more than age groups do.
Are men faster than women at reacting?
Only negligibly. In the largest adult study (over 7,000 people), mean reaction time differed little between sexes, and controlled work found the age slope of simple reaction time is unaffected by sex. Differences between individuals dwarf any group gap.
Why is my online reaction time slower than lab numbers?
Because your device sits inside the measurement. A 60 Hz screen only refreshes every 16.7 ms, operating systems add input and display lag — around 30 ms is typical on a desktop — and touchscreens are slower still. Lab auditory or tactile tests avoid most of that.
Does fast reaction time mean I'll be good at video games?
It helps at the margins, but it is one ingredient among several. Action gamers do react faster on attention tests without losing accuracy, yet aiming, tracking, positioning, and decision-making are separate skills that a reaction test does not measure.
What is the fastest human reaction time?
For a deliberate visual reaction — see a signal, decide, then move — the practical floor is roughly 100–120 ms, reached by trained athletes. World Athletics treats a sprint-start reaction faster than 100 ms as a false start precisely because anything quicker is usually anticipation rather than reaction. In an online test, scores under about 100 ms almost always mean a guessed click or a display/input artefact.
How much does reaction time decline with age?
Less than most people assume. Controlled data put the decline at roughly 0.55 ms per year, from about 200 ms in the youngest adults to about 222 ms by age 65, and simple reaction time holds fairly steady until around age 50. The extra milliseconds come mainly from the movement stage, not from seeing the signal later.
If you want the measurement background behind these averages, browse the reaction time guides first.
References
- Kosinski, R. J. (2012). A Literature Review on Reaction Time. Clemson University (Internet Archive copy).
- Woods, D. L., Wyma, J. M., Yund, E. W., Herron, T. J., & Reed, B. (2015). Factors influencing the latency of simple reaction time. Frontiers in Human Neuroscience, 9, 131.
- Der, G., & Deary, I. J. (2006). Age and sex differences in reaction time in adulthood: results from the United Kingdom Health and Lifestyle Survey. Psychology and Aging, 21(1), 62–73.
- Dawson, D., & Reid, K. (1997). Fatigue, alcohol and performance impairment. Nature, 388, 235.
- Van Dongen, H. P. A., Maislin, G., Mullington, J. M., & Dinges, D. F. (2003). The cumulative cost of additional wakefulness. Sleep, 26(2), 117–126.
- Einöther, S. J. L., & Giesbrecht, T. (2013). Caffeine as an attention enhancer: reviewing existing evidence. Psychopharmacology, 225(2), 251–274.
- Dye, M. W. G., Green, C. S., & Bavelier, D. (2009). Increasing speed of processing with action video games. Current Directions in Psychological Science, 18(6), 321–326.
- Kukolj, M., Okic, T., & Dopsaj, M. (2013). Reaction time aspects of elite sprinters in athletics world championships. Journal of Strength and Conditioning Research.
- Human Benchmark reaction time statistics (81M+ recorded clicks).